
Congestion Management Process Analysis Tool
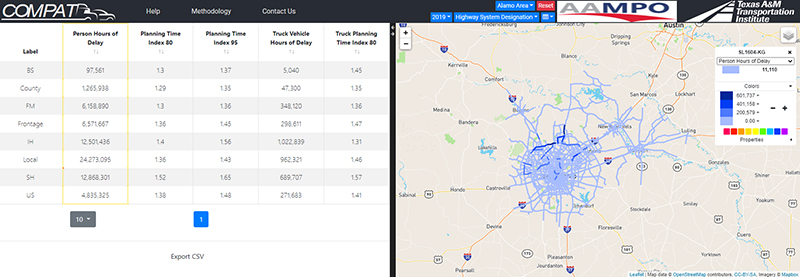
The Congestion Management Process Analysis Tool (COMPAT) is a web-based product that allows the user access to annual traffic congestion statistics on the majority of roads in an individual Texas metropolitan area. COMPAT is designed to help local agencies such as metropolitan planning organizations monitor traffic congestion on area roadways and to easily be able to incorporate this information into their business processes such as the Congestion Management Process (CMP). The user can create summary reports of the statistics at various geographic levels from statewide down to an individual corridor and based on many transportation elements such as functional roadway classification or roads on a certain network such as the National Highway System. The tool allows the user to view congestion information on an individual link of road or create an analysis corridor by selecting the beginning and ending segments of a corridor. The tool is still under construction with more features to be added.
Truck Congestion Analysis Tool
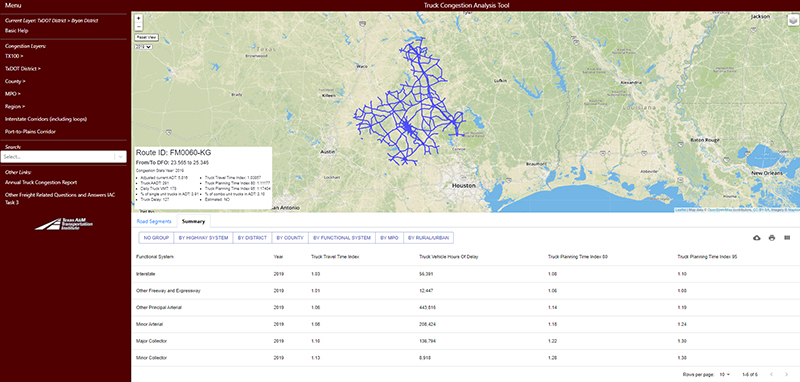
The Truck Congestion Analysis Tool (TCAT) is a web-based product that allows the user access to annual truck-based traffic congestion statistics on the majority of roads in Texas from 2017 to present. The user can create summary reports of the statistics at various geographic levels from statewide down to an individual corridor and based on many transportation elements such as functional roadway classification or roads that are included on a certain network such as the National Highway System. The tool allows the user to view congestion information on an individual link of road or create an analysis corridor by selecting the beginning and ending segments of the corridor. The tool is still under construction with many more features to be added in the coming years including:
- Ability to examine trends in congestion
- Location information for truck-trip producers such as intermodal facilities, warehousing areas, ports of entry, etc.
- Select link analyses of trip patterns on some of the more congestion corridors in Texas
Congestion On District Roadways
The Congestion On District Roadways (CODR) tool is a web-based product that allows the user access to annual traffic congestion statistics on the majority of roads in an individual Texas Department of Transportation District. CODR is designed to help the local transportation officials monitor traffic congestion on area roadways and to easily be able to incorporate this information into their business processes. The user can create summary reports of the statistics at various geographic levels from statewide down to an individual corridor and based on many transportation elements such as functional roadway classification or roads on a certain network such as the National Highway System. The tool allows the user to view congestion information on an individual link of road or create an analysis corridor by selecting the beginning and ending segments of a corridor. The tool is still under construction with more features to be added.