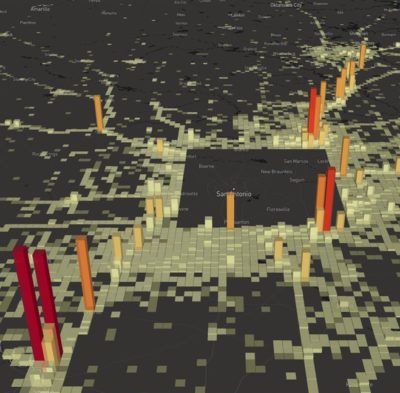
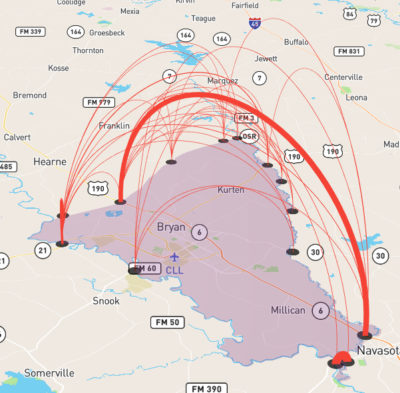
Using data analysis and interactive reporting/presentation techniques in R, Python, and Jupyter Notebooks, the team is able to relay results from analyses quickly as projects progress. The team has also developed a number of skills for visualizing origin-destination characteristics and travel patterns from passive data and roadway networks, including interactive graphics (MAG External Travel Study) and interactive 3-D maps like those shown below.
Visualizing Travel Patterns Using Passive Data
TTI’s Travel Survey and Passive Data research team has developed a number of methods for visualizing travel patterns, focusing on telling the story of where travel is coming from, where it is going and how it is getting there.