
2021 Urban Mobility Report
For More Information
For more information, contact:
David Schrank
(979) 317-2464
[email protected]
Bill Eisele
(979) 317-2461
[email protected]
First published in 1987, TTI’s Urban Mobility Report (UMR) has been referenced more than 10,000 times by major publications and broadcast outlets. Newspapers including The New York Times, Washington Post, Chicago Tribune and USA Today have featured the study’s findings. Stories have appeared on CNN, CBS This Morning, NBC Today and Fox News, making the UMR the definitive measure of traffic congestion in America for decision-makers and elected officials at the local, state and national level.
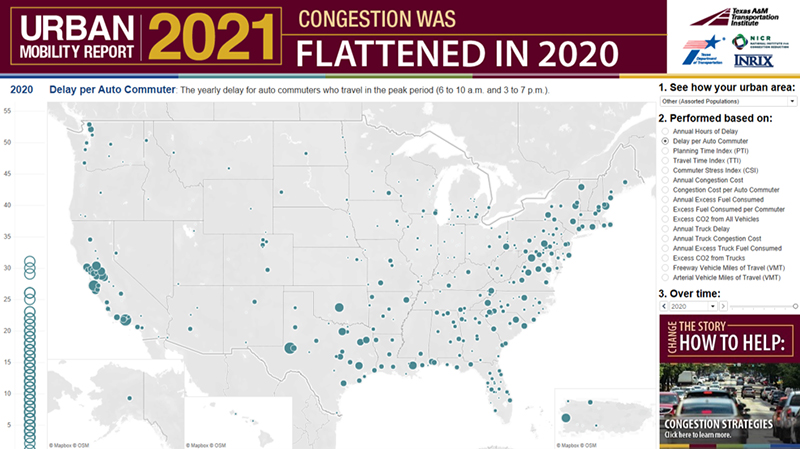
TTI’s 2021 edition uses crowdsourced data from INRIX on urban streets and highways, along with highway inventory data from a Federal Highway Administration database. The report was sponsored by the Texas Department of Transportation and the National Institute for Congestion Reduction.
What we are saying about the transportation effects of COVID-19.
Read what authors of the UMR are saying about the transportation effects and possible implications of this unique time in human history.
Read what authors of the UMR are saying about the transportation effects and possible implications of this unique time in human history.